Litchfield Park
33.4934° N, 112.3577° W
33.4934° N, 112.3577° W
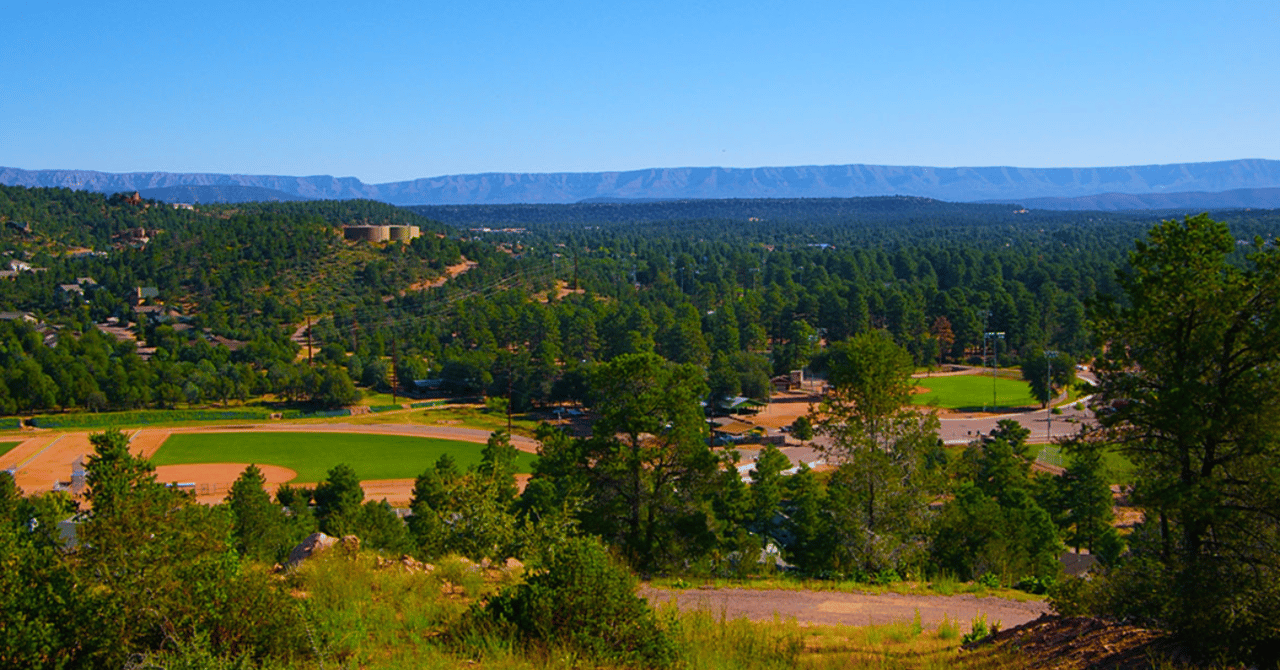
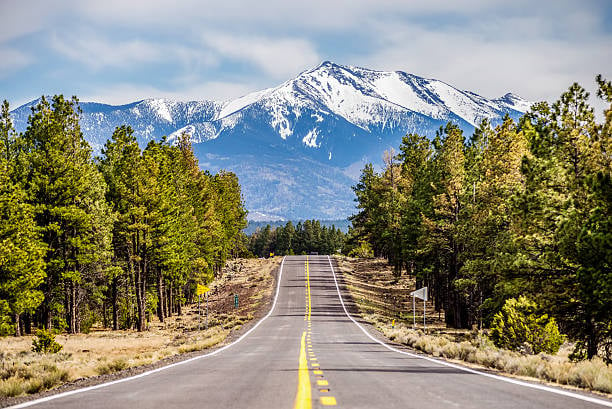
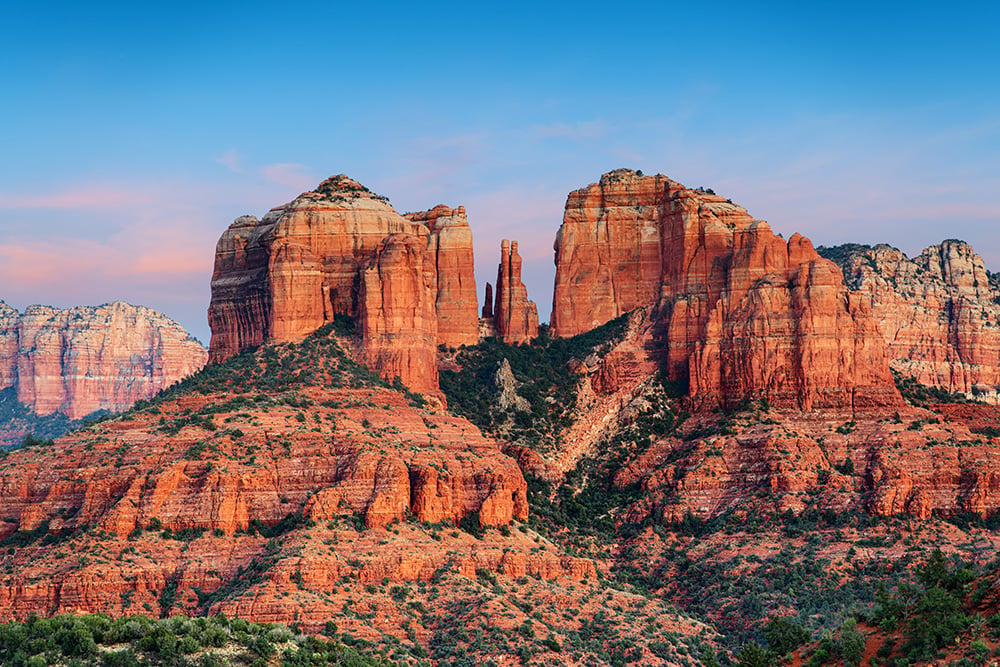
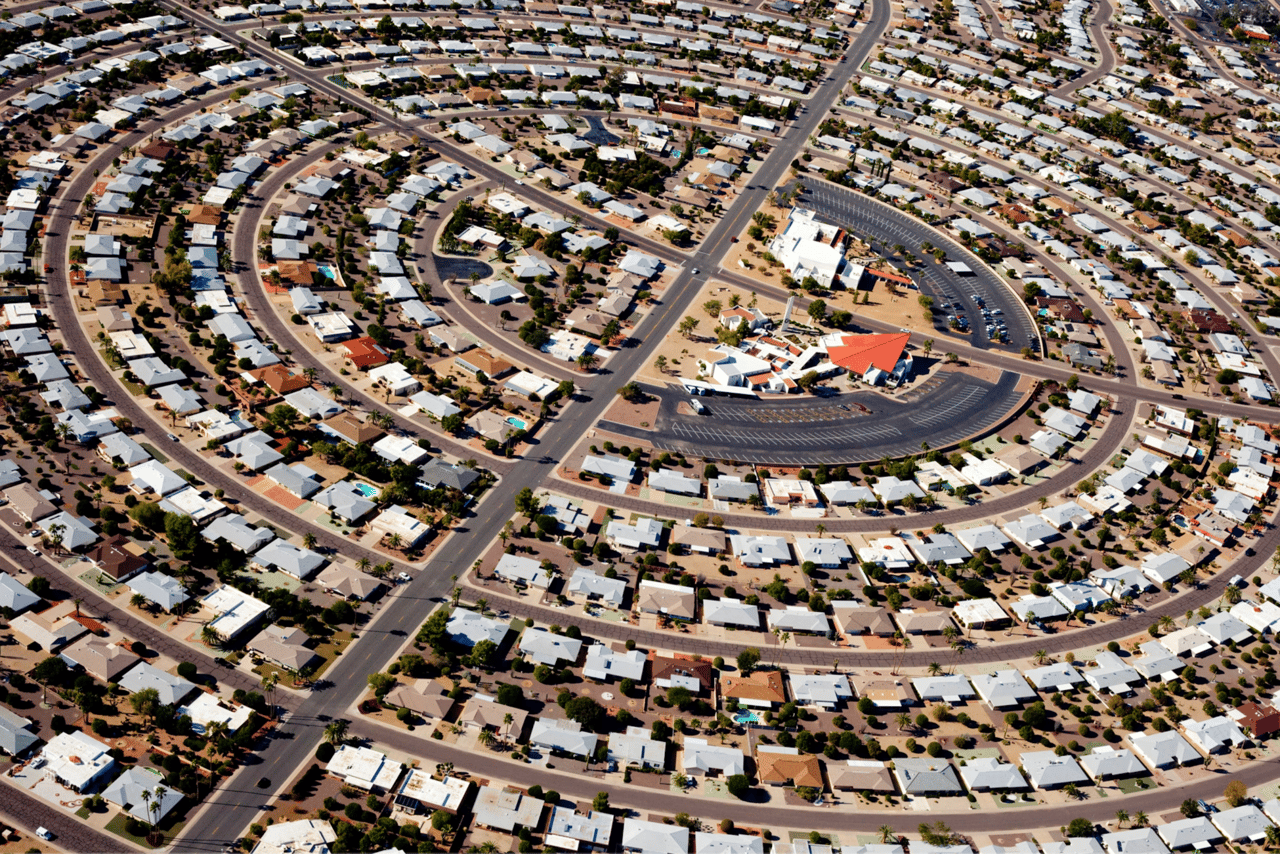
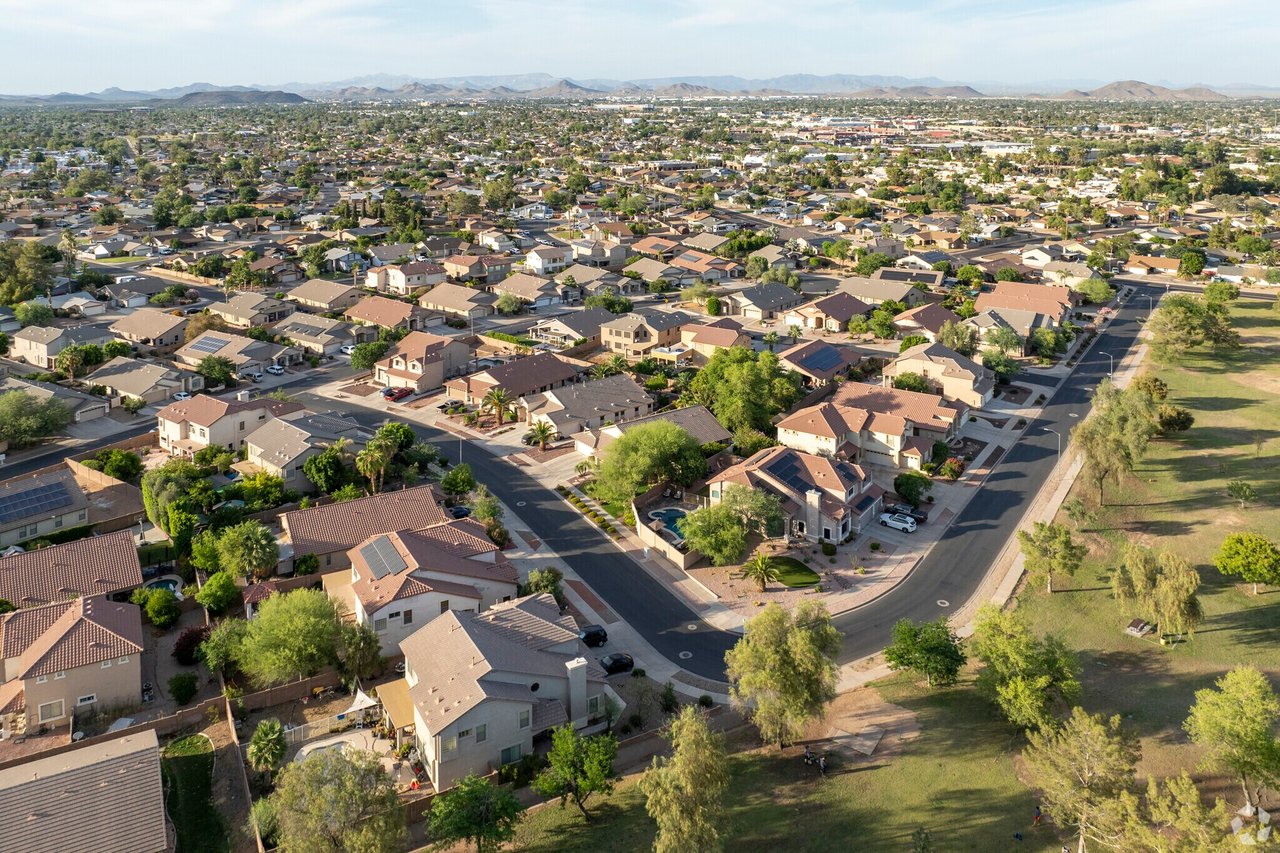
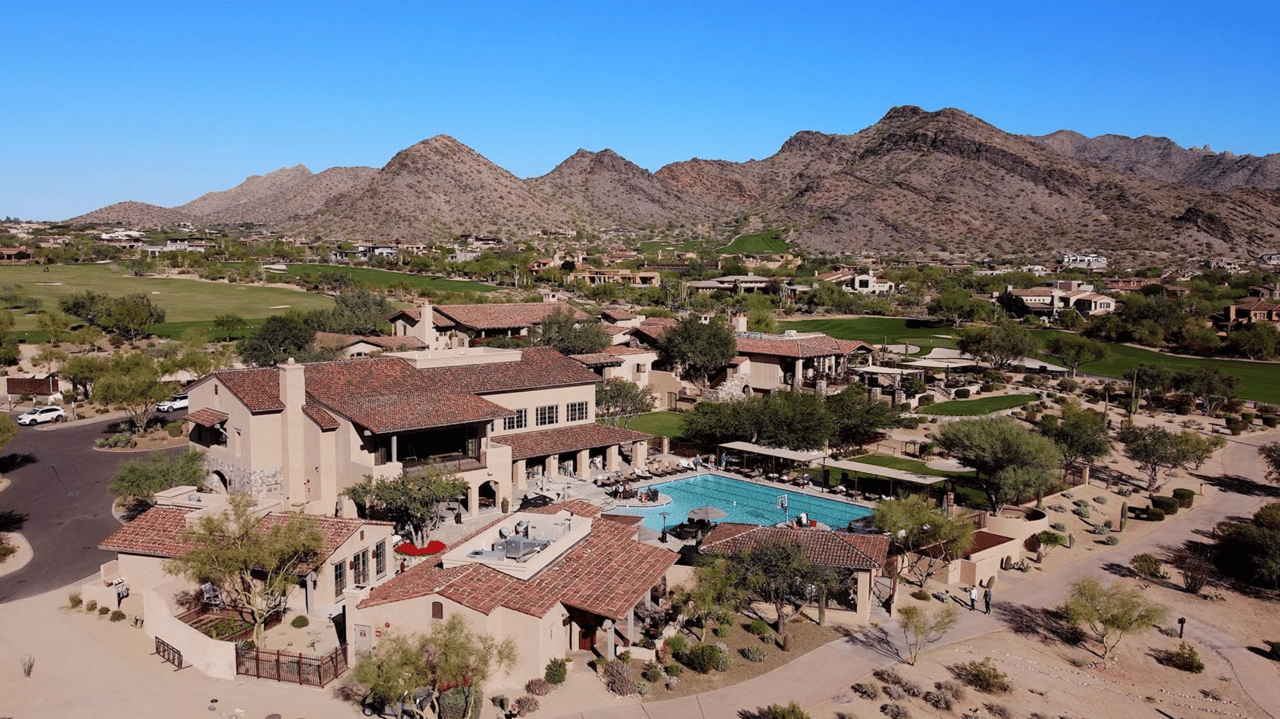
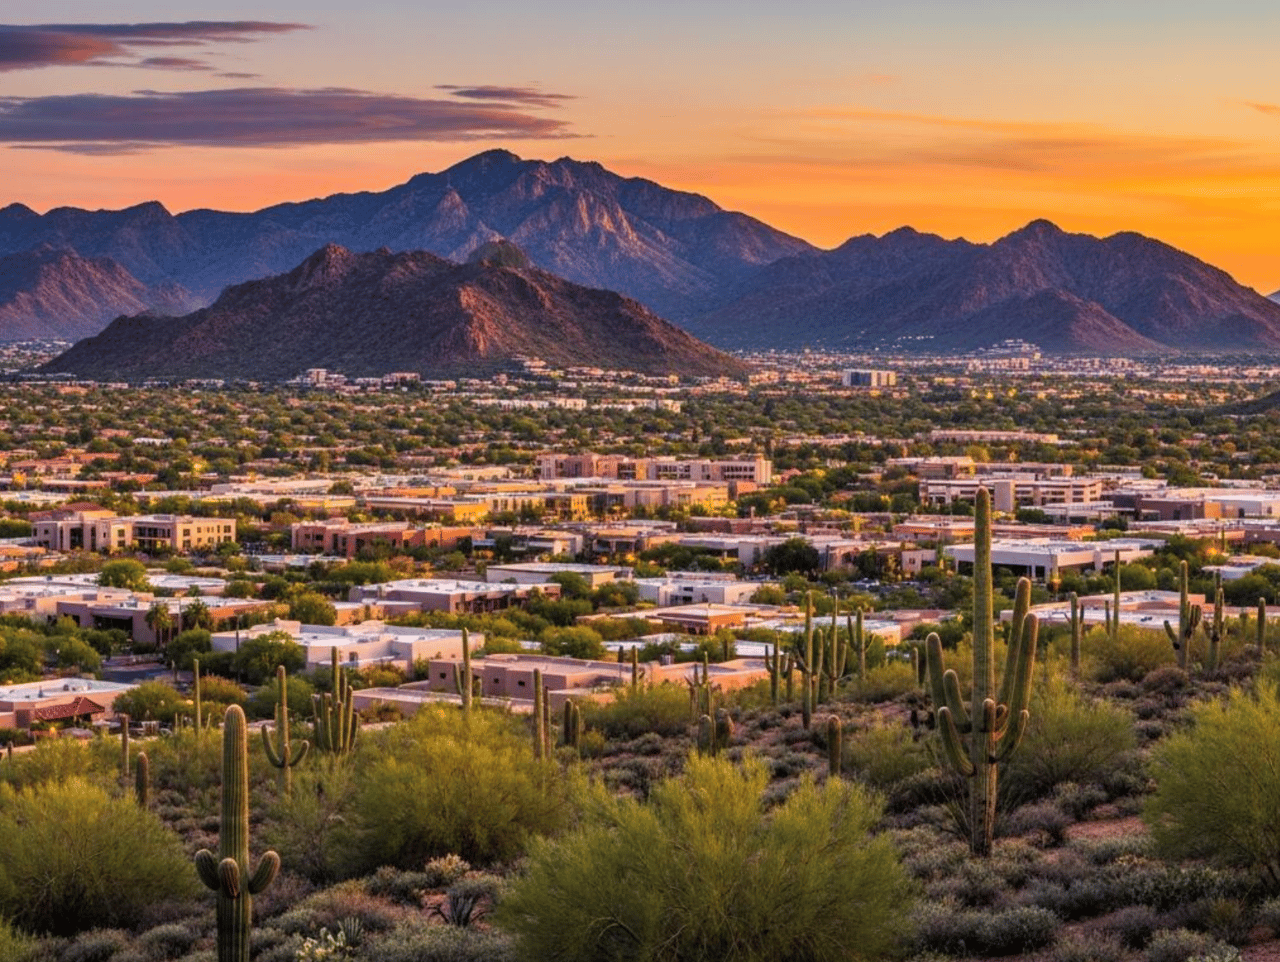
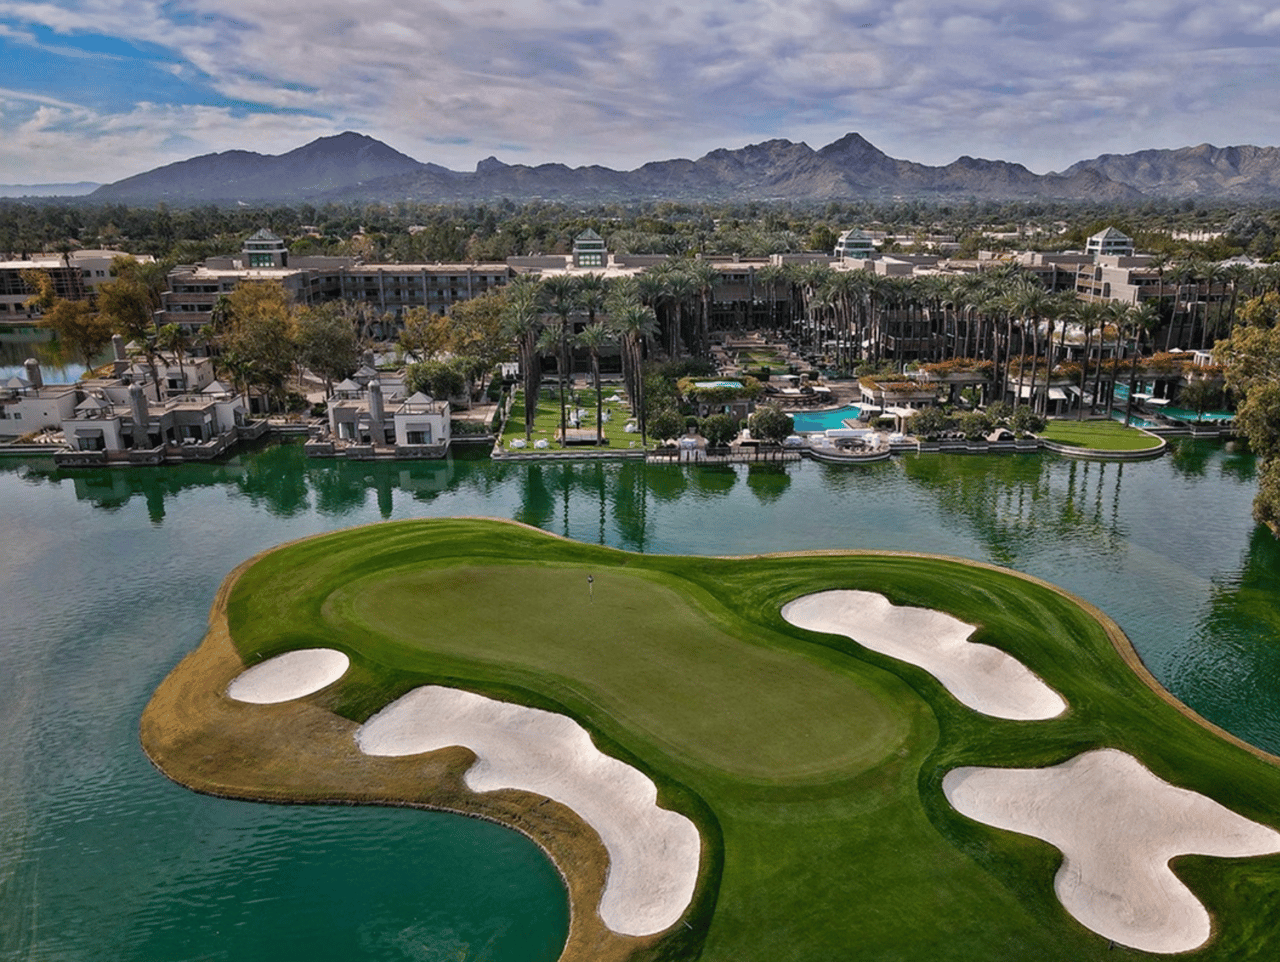
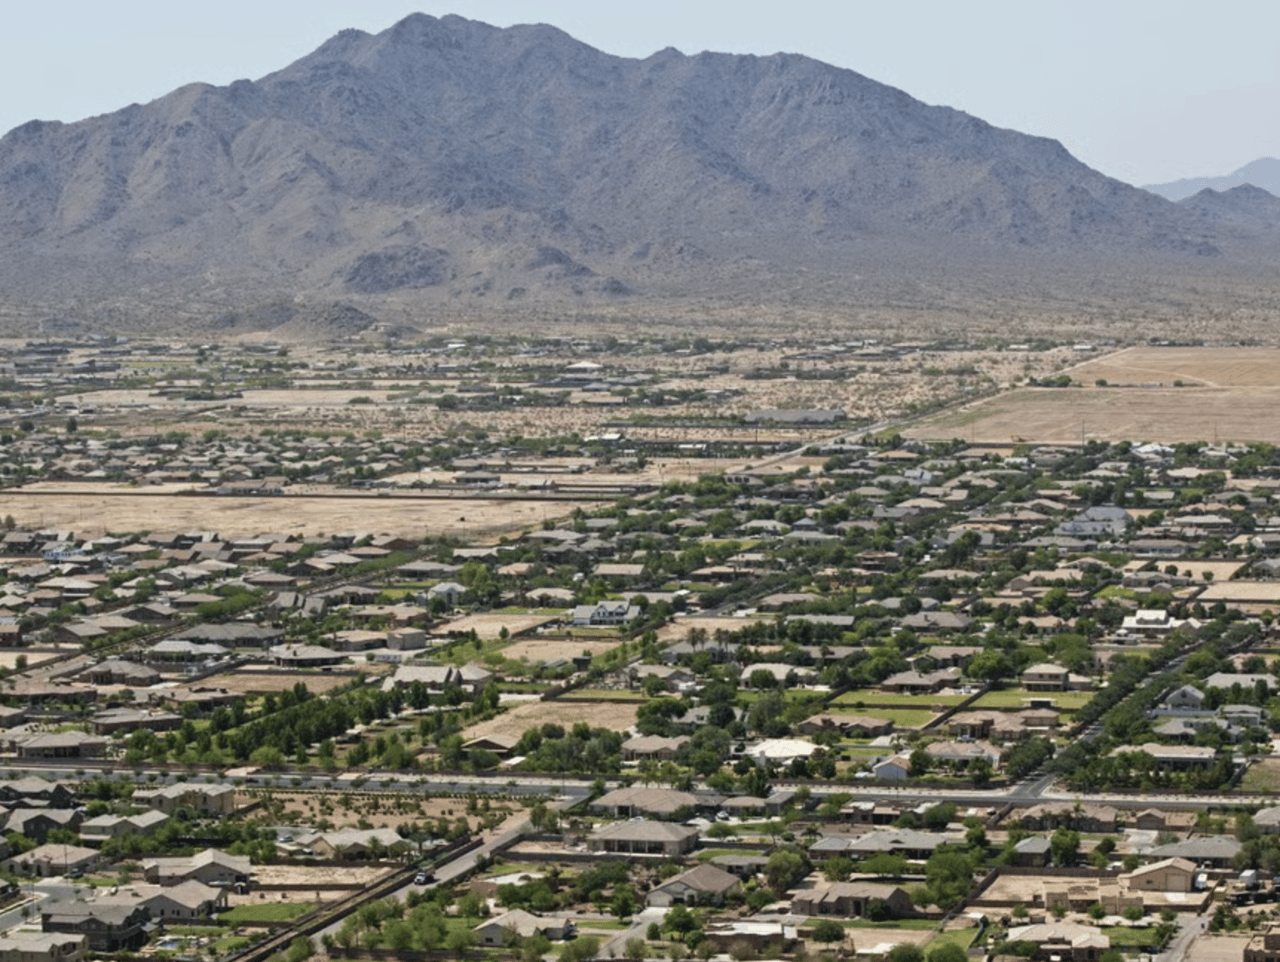
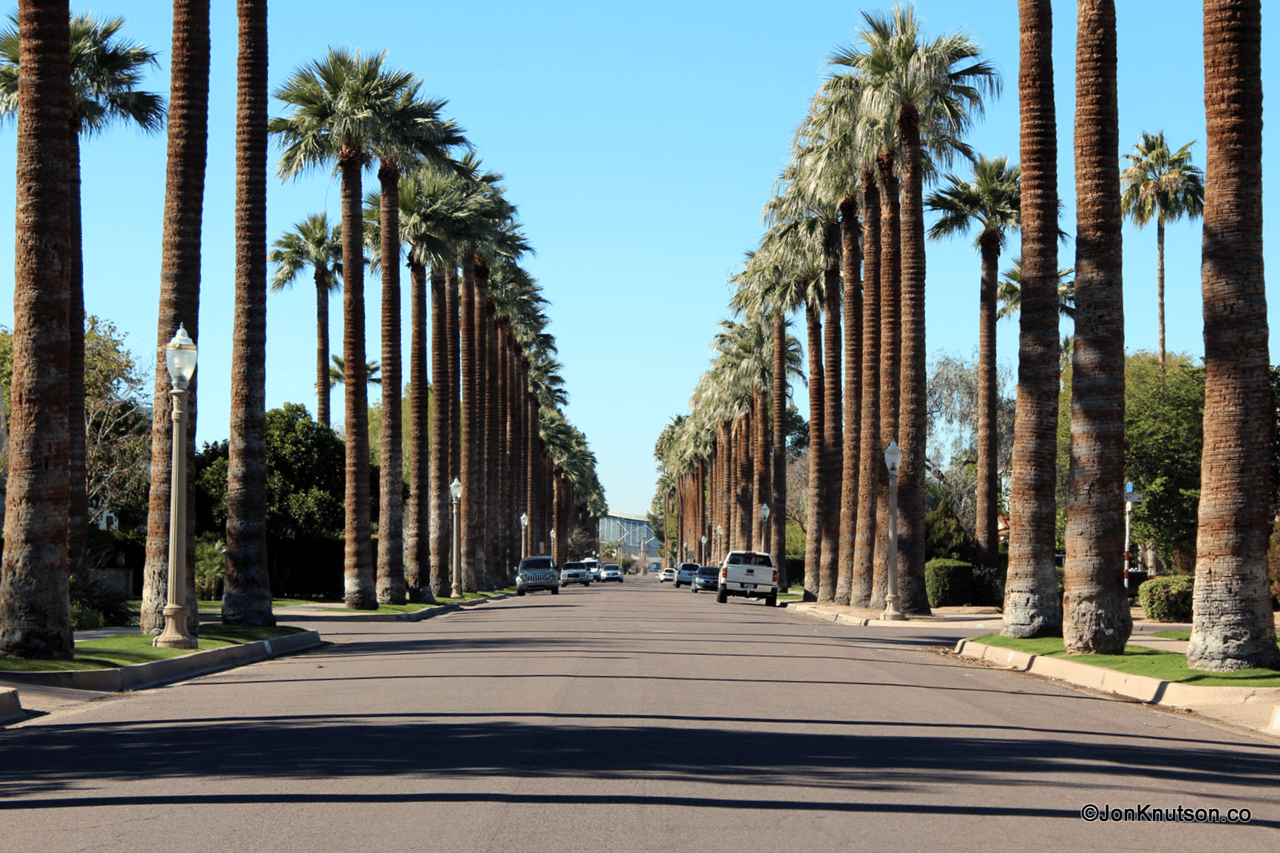
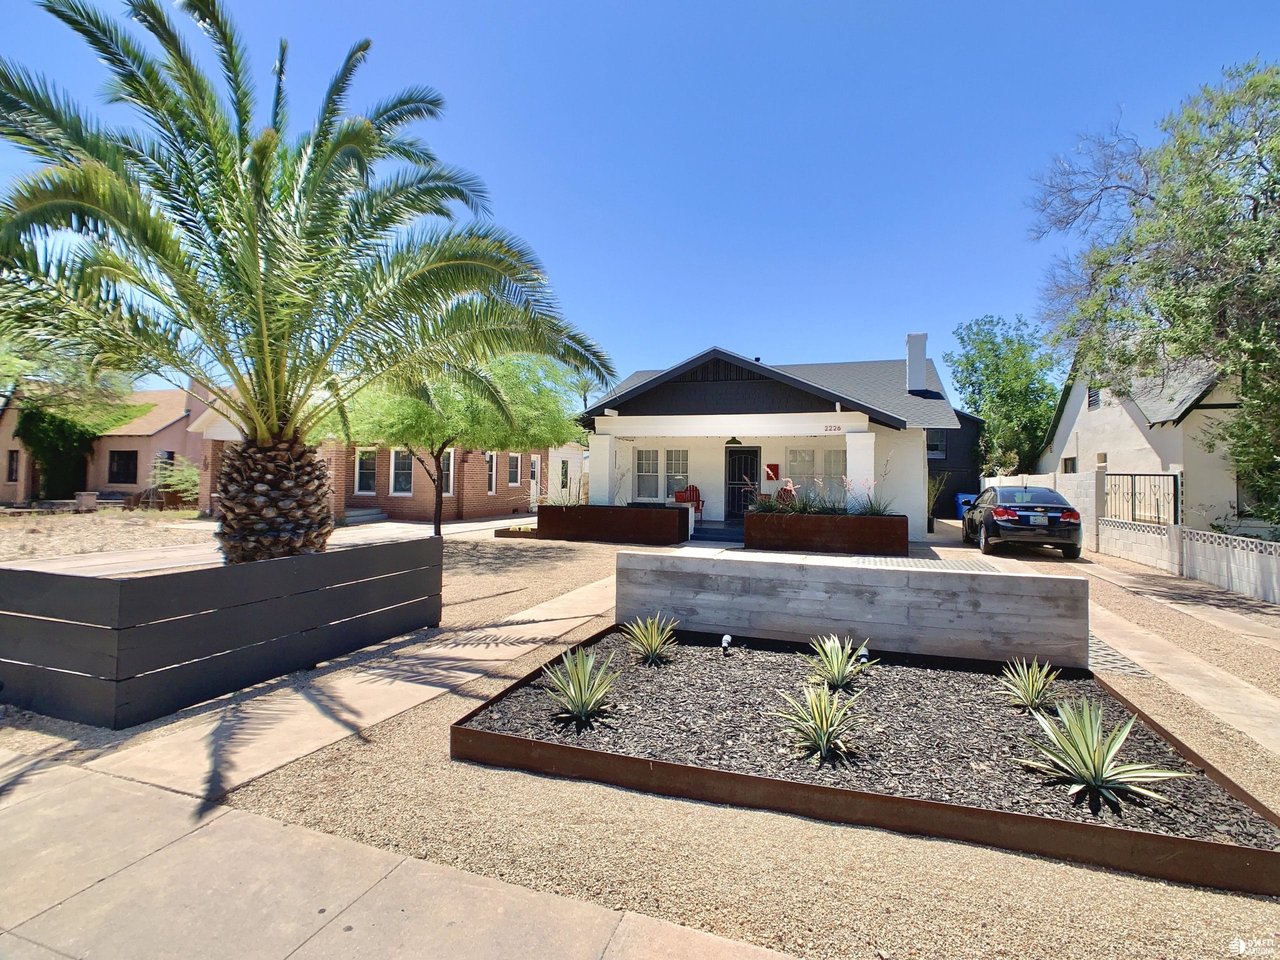
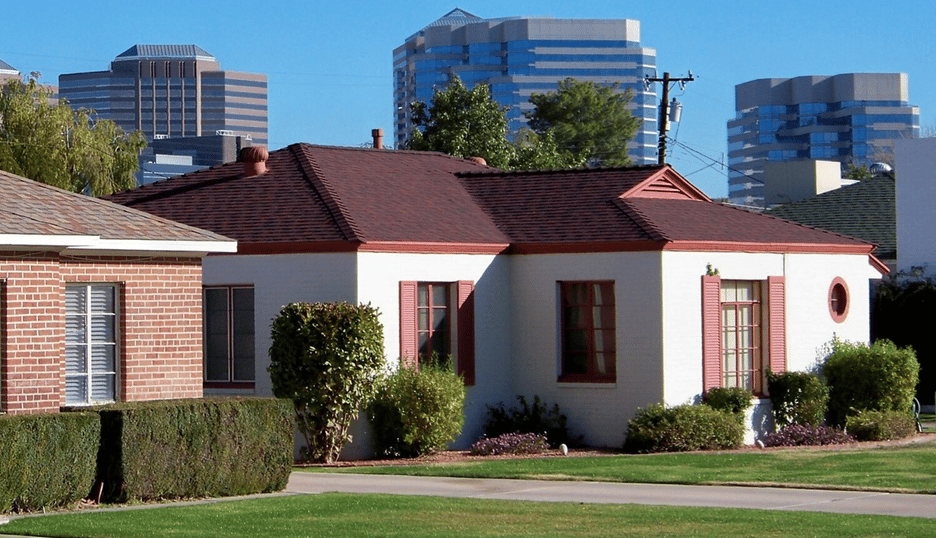
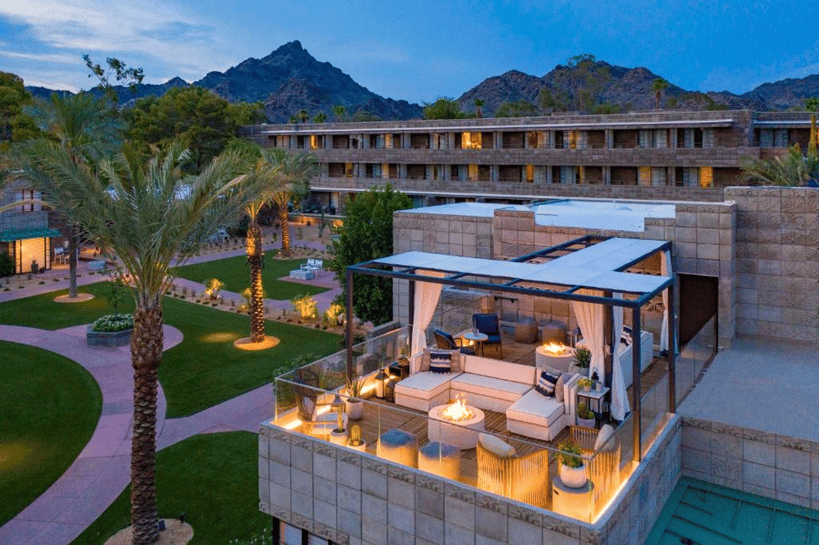
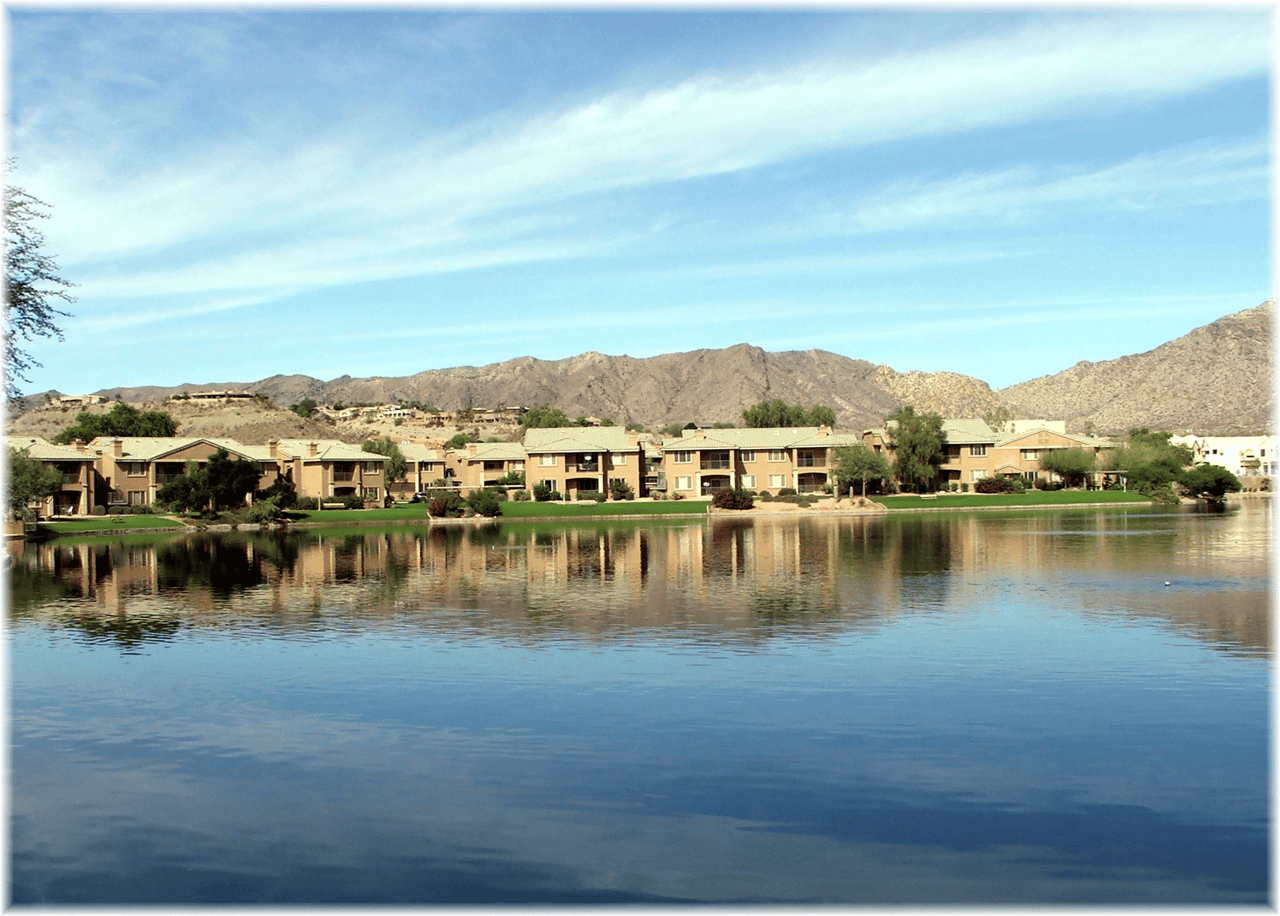
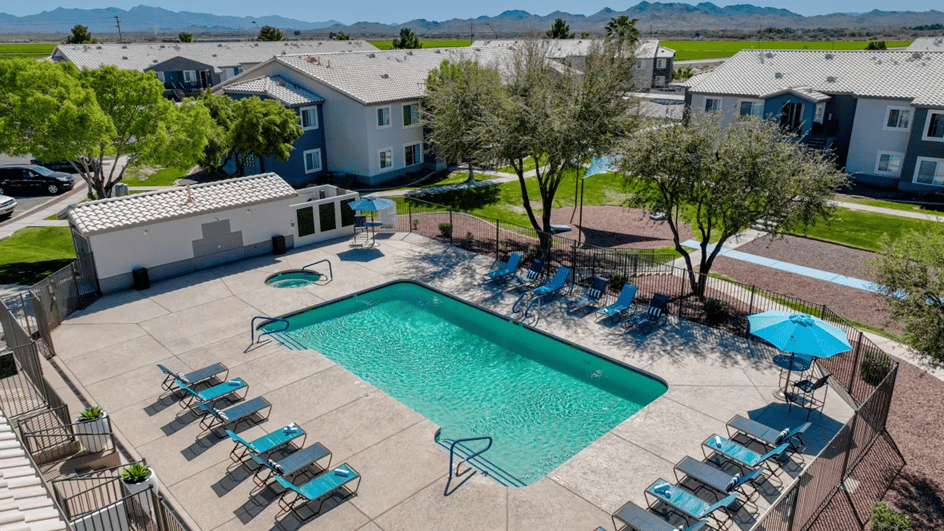
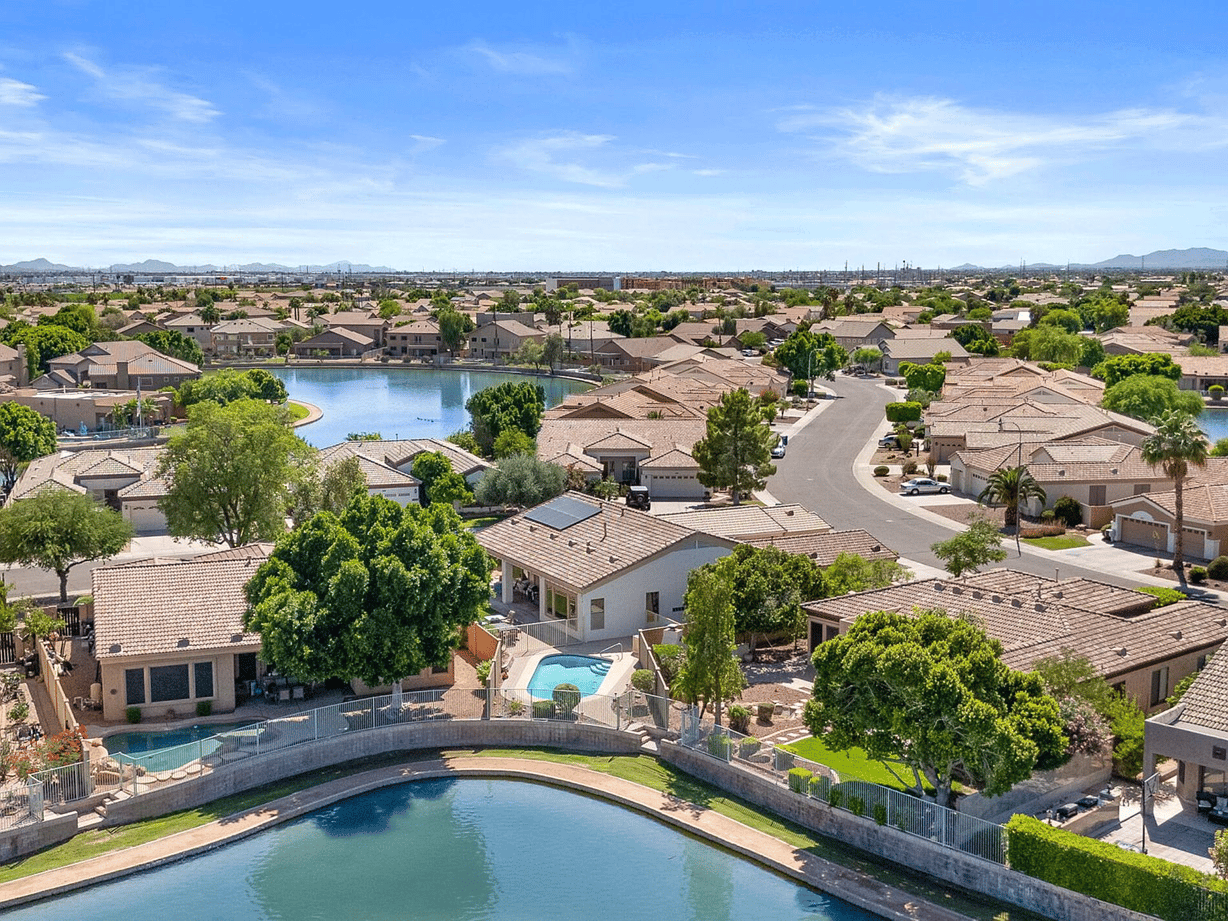
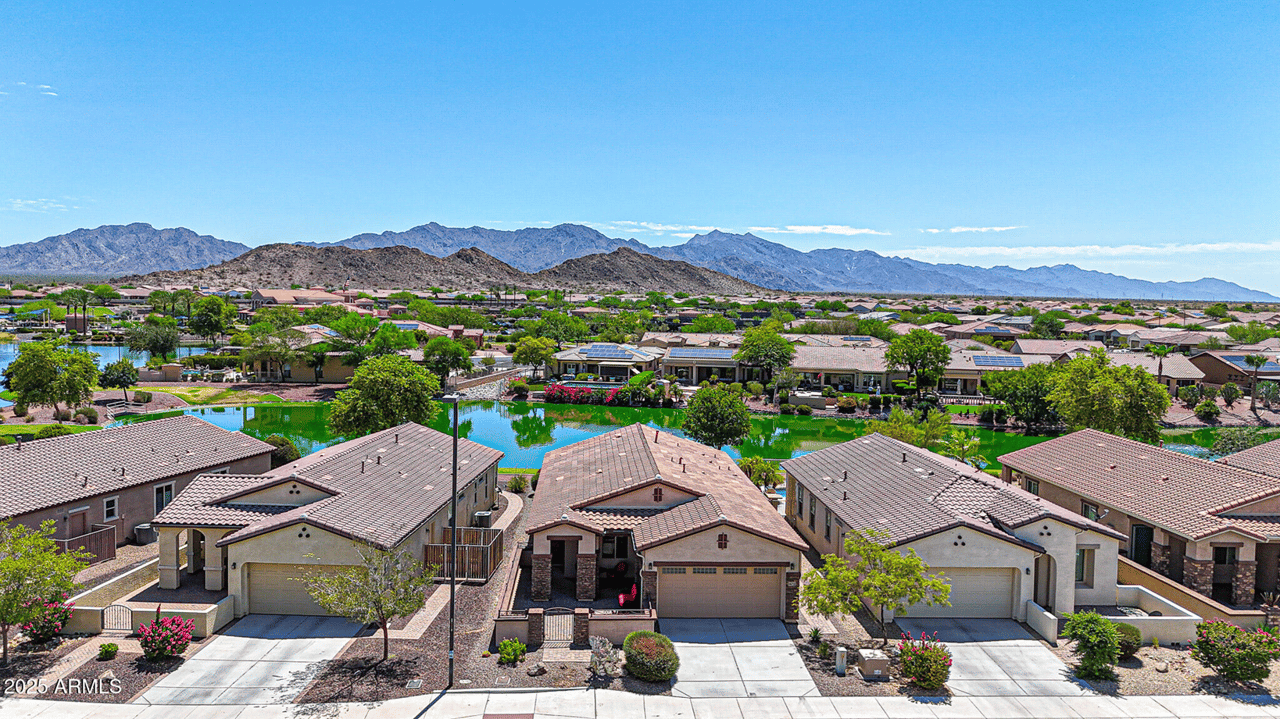
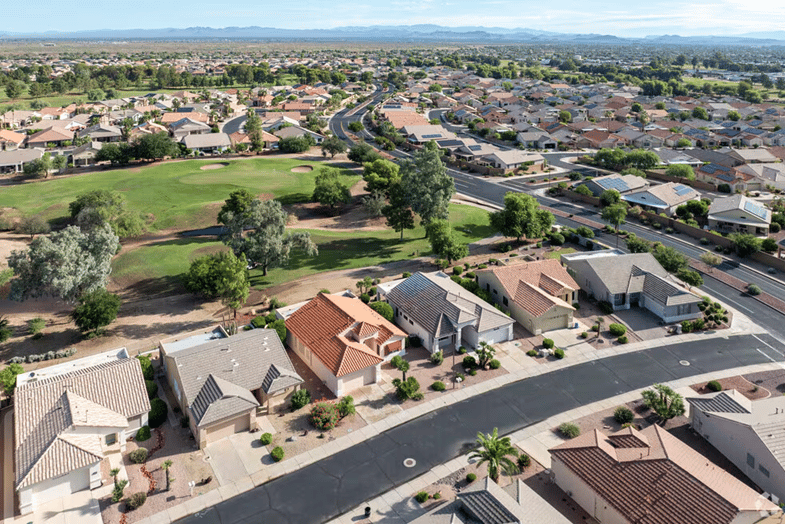
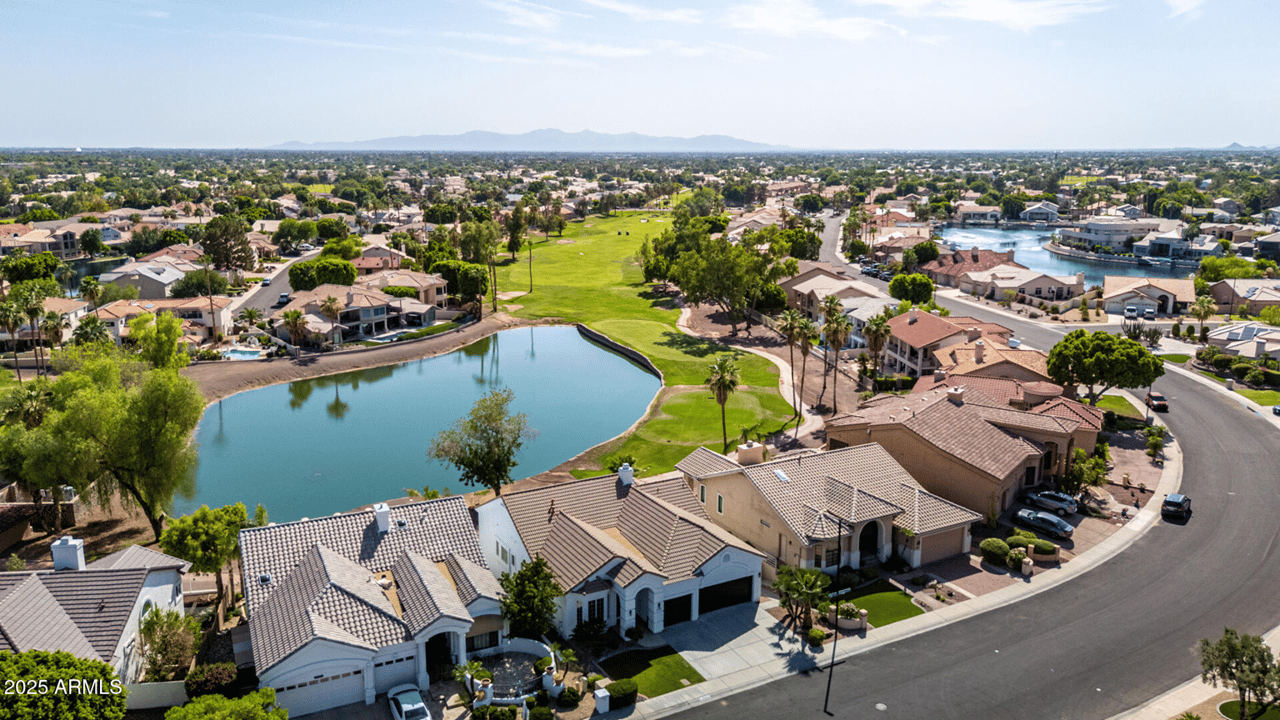
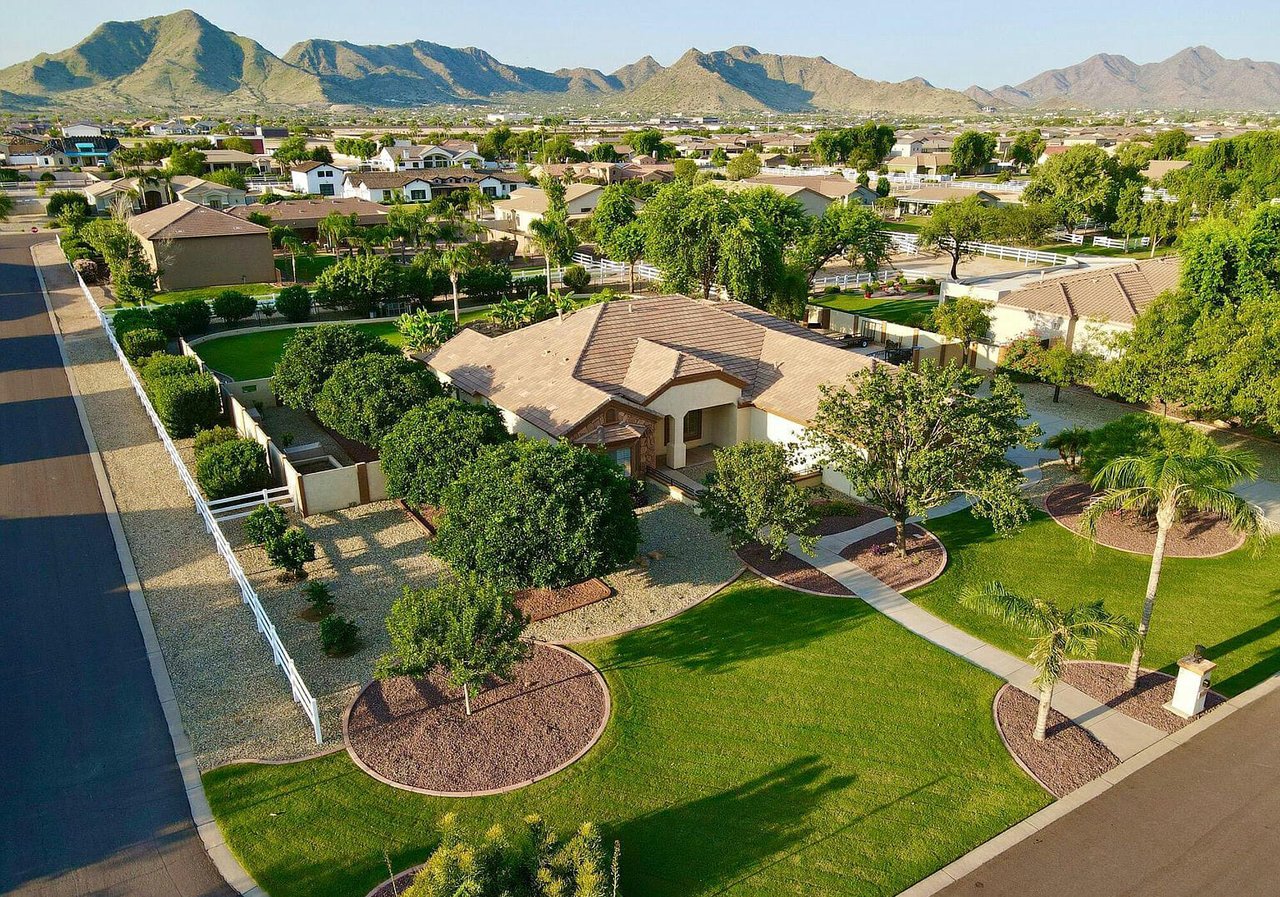
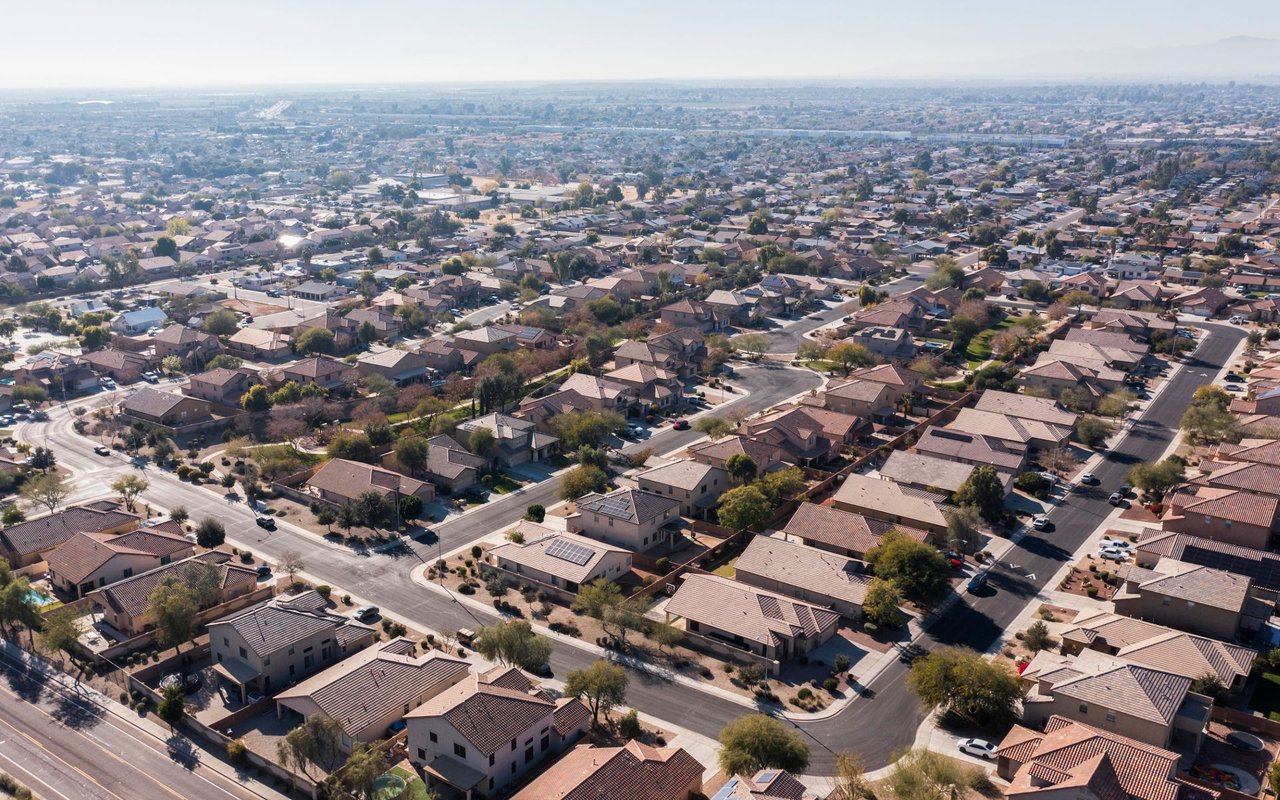
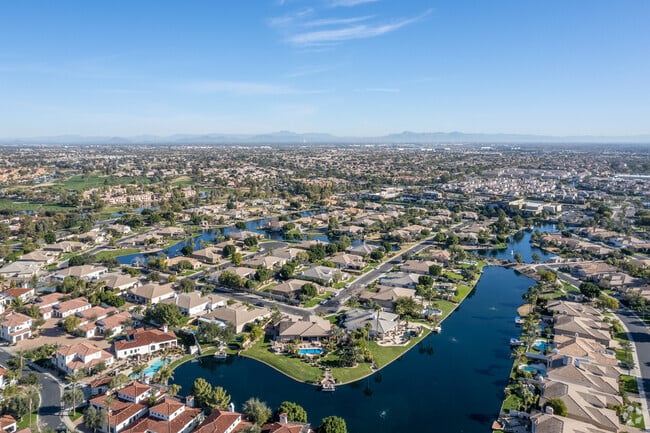
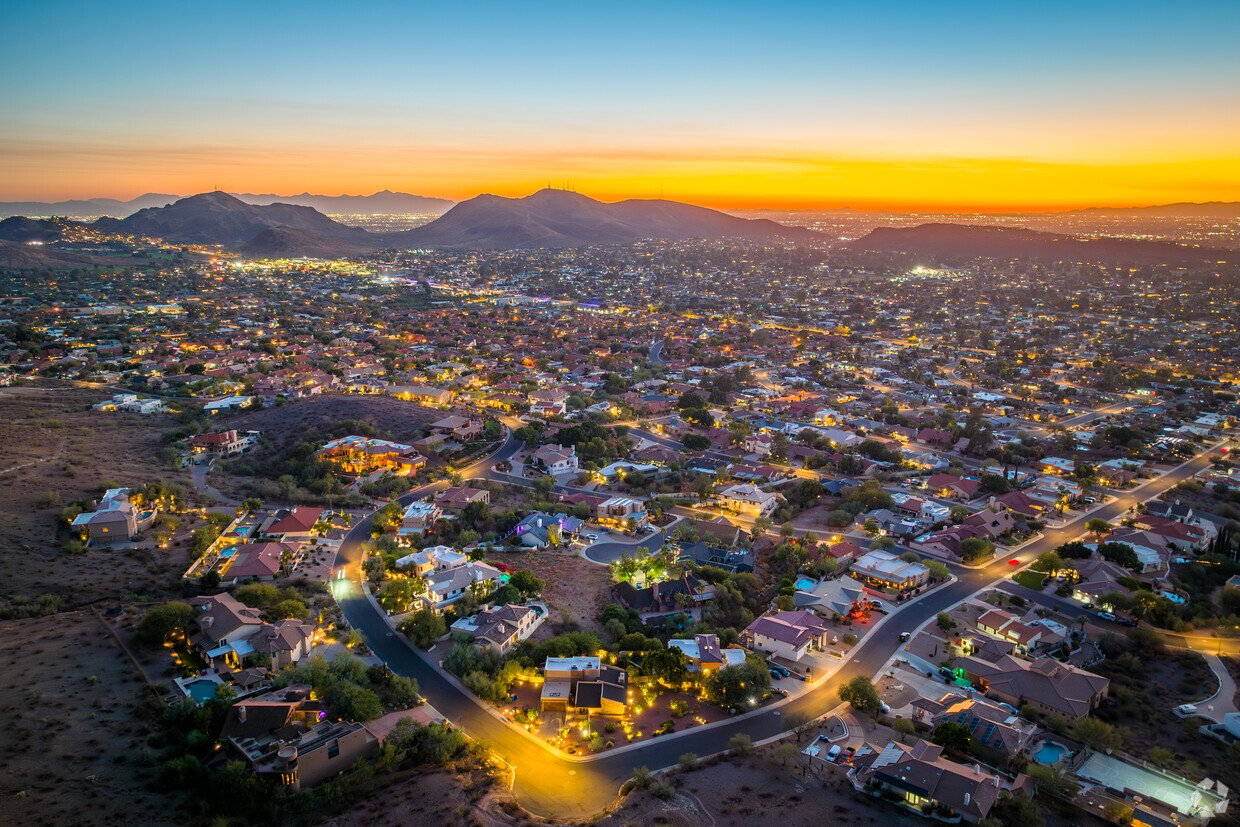
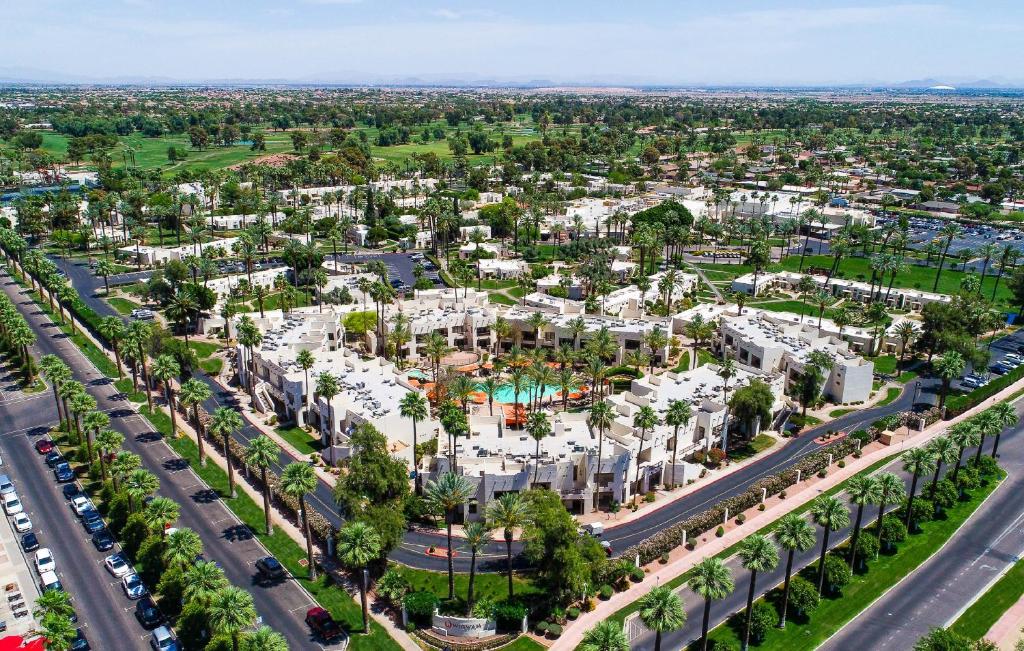
Litchfield Park, Arizona blends small-town charm, beautiful surroundings, and a relaxed lifestyle into one of the most inviting places to live in the Valley. Known for its tree-lined streets, scenic golf courses, and historic character, Litchfield Park offers a peaceful yet connected community. Residents love the local feel of Old Litchfield Road, the luxury of The Wigwam Resort, and the abundance of parks and outdoor spaces perfect for year-round activities. Whether you're looking for championship golf, community events, or a slower pace with easy access to the city, Litchfield Park feels like a hidden gem in the desert.
35,643 people live in Litchfield Park, where the median age is 37.3 and the average individual income is $38,226. Data provided by the U.S. Census Bureau.
Total Population
Median Age
Population Density Population Density This is the number of people per square mile in a neighborhood.
Average individual Income
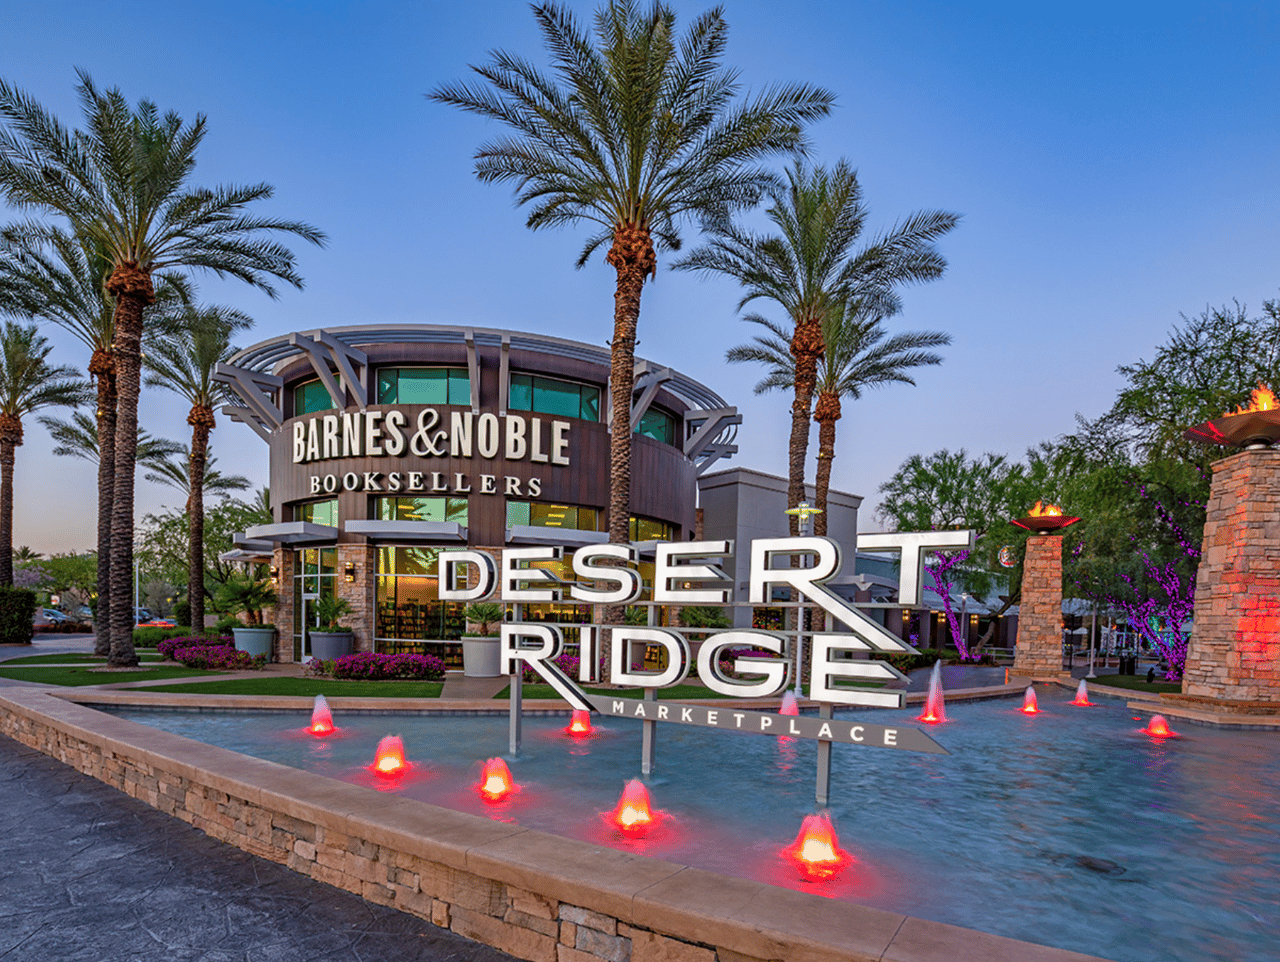
There's plenty to do around Litchfield Park, including shopping, dining, nightlife, parks, and more. Data provided by Walk Score and Yelp.
Explore popular things to do in the area, including Arie Layne Boutique, Melodies and Me, and TaekwonKids.
| Name | Category | Distance | Reviews |
Ratings by
Yelp
|
|---|---|---|---|---|
| Shopping | 3.86 miles | 13 reviews | 4.9/5 stars | |
| Active | 4.49 miles | 6 reviews | 5/5 stars | |
| Active | 4.76 miles | 28 reviews | 5/5 stars | |
| Active | 4.42 miles | 18 reviews | 5/5 stars | |
| Beauty | 1.8 miles | 12 reviews | 5/5 stars | |
| Beauty | 3.78 miles | 8 reviews | 5/5 stars | |
|
|
||||
|
|
||||
|
|
||||
|
|
||||
|
|
||||
|
|
Litchfield Park has 11,398 households, with an average household size of 3.12. Data provided by the U.S. Census Bureau. Here’s what the people living in Litchfield Park do for work — and how long it takes them to get there. Data provided by the U.S. Census Bureau. 35,643 people call Litchfield Park home. The population density is 1,138.84 and the largest age group is Data provided by the U.S. Census Bureau.
Total Population
Population Density Population Density This is the number of people per square mile in a neighborhood.
Median Age
Men vs Women
Population by Age Group
0-9 Years
10-17 Years
18-24 Years
25-64 Years
65-74 Years
75+ Years
Education Level
Total Households
Average Household Size
Average individual Income
Households with Children
With Children:
Without Children:
Marital Status
Blue vs White Collar Workers
Blue Collar:
White Collar:
If you're seeking a caring and knowledgeable professional to guide you, Megan is the answer. Contact her today and embark on your journey to a new home with confidence
Megan Keruskin
4222 N Marshall Way Scottsdale AZ 85251